Tutorial: Correlation resampling
Method Overview
This method examines the gene expression profiles themselves, not the gene scores for each gene (which is how the other methods like ORA work). A score is computed for a gene set based on how correlated the expression profiles are.
This can be thought of as a measure of how well the genes in the set cluster together, but they need not all be in the same cluster. Thus a gene set that contains two coherent clusters that encompass most of the genes in the set will tend to get a good score (though not as good as a gene set that is just one big cluster).
When to use correlation scoring
If you are interested in gene clustering, as opposed to simply looking at differntial expression, this method is appropriate. If you feel limited by the choice of distance metrics in ermineJ, ORA would be an alternative, but you have to define distinct clusters of genes to do that.
One alternative use of correlation scoring is as a control for gene-score-based analysis. Correlated gene sets can cause spurious high scores, especially if the differential expression in your study is weak. To use this approach, you could first use gene-score-based analysis (e.g., gene score resampling and then analyze the data using correlation analysis. If any of your gene sets have high scores in both analyses, you should look at the data to see if the correlation is not associated with the differential expression. This is a simple (but ad hoc) alternative to using resampling over the samples to do the gene-score-based analysis.
How your data file is used
Unlike the other methods ErmineJ offers that are based on scores for each gene, the correlation method uses the expression data provided in the “raw” file. No gene score file is needed (and it is not used by this analysis at all).
The rows of the raw data file are treated as a set of expression profiles, one for each gene (or probe). The method examines the correlations among these profiles. Thus you should make sure your input raw data is scaled/normalized the way you would if you were going to use clustering. Note: ErmineJ does not use the sample types in its analysis. The names of the samples in your raw data file (the column headings) are only used for display.
Walkthrough
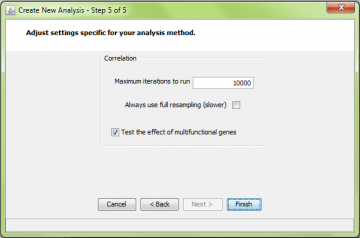
If you have read the ORA page (please do), you will recognize the first 5 steps of the wizard. The only different one is the last step:
Note that the “gene replicate treatment” choice in step 5 does not apply to correlation analysis at this time. All correlation analyses use the “mean” method of weighting multiple comparisons among genes. Comparisons of a gene to itself are always skipped. That is, if there are two probes for a gene, they are not compared.
Correlation resampling is the most computationally intensive method implemented by ermineJ. For this reason we recommend setting the number of iterations lower, perhaps only 10,000. In addition, running larger class sizes takes longer than smaller ones, a consideration you might use when setting the parameters.
