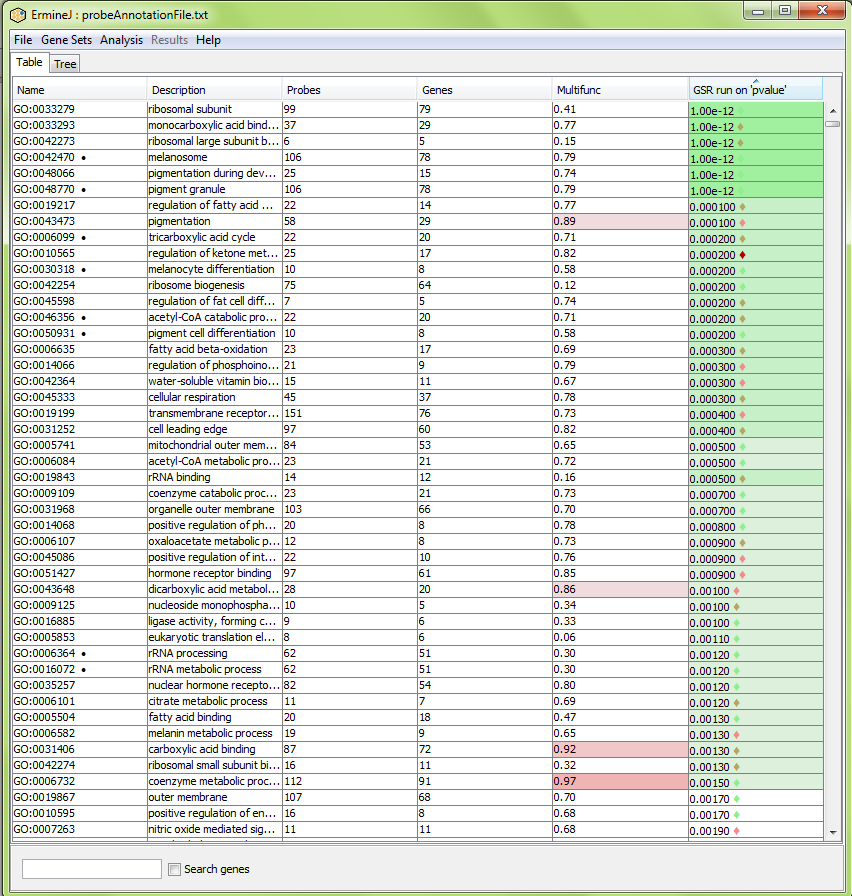
Tabular view of an analysis
Analysis results in the default table view, with green indicating statistical significance.
Tree view of gene sets after an analysis
ErmineJ includes both a tabular and tree view of the gene sets. In both views, gene sets are color-coded to indicate statistical significance.

Details view of a gene set
Visualizing the raw data for a gene set is easily done:

Creating a new gene set
You can easily modify and create new gene sets in ermineJ
