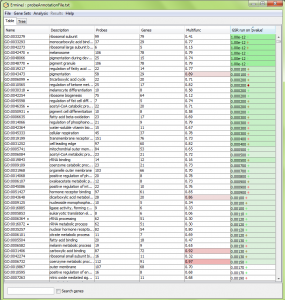
ErmineJ uses Benjamini-Hochberg assessment of p values to determine which gene sets are selected with a particular false discovery rate (FDR). High-ranking sets are colored shades of color in the pval column, as shown in the figure below. Gene sets which to not meet the criterion are not colored. Currently gene sets with FDRs higher than 0.1 are plain white.
Brighter shades of color indicate lower FDRs. Currently the colors indicate FDRs of 0.001, 0.01, 0.05 and 0.1. If you have trouble figuring out which color is which, just look at the tooltip you get when you point the mouse at a result, or save the results to a file – the corrected p-values are saved in their own column.
Note that the color reflects the FDR when the p values for the gene set indicated is used as the threshold. Thus it is possible for the FDR to go up and down as you go down the list. It is not uncommon for the FDR at very stringent thresholds to be above 0.05, while at less stringent thresholds is can be lower. This counterintuitive result is due to the way the FDR is computed. If you want to control the FDR at 0.05, you should pick the lowest-ranked gene set that has that FDR, and all gene sets listed above would be selected.
If you feel using the FDR is not appropriate, Bonferroni correction can be accessed from the command line interface. You can also work with the results file you save to compute other types of corrected p values from your data.
