Using ermineJ for the first time
This page introduces what you will see when you first run ermineJ. Details on how to run an analysis, view the details of a gene set and other tasks are detailed elsewhere.
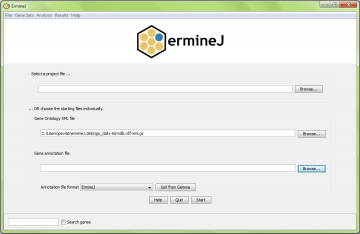
When you first start up the software, you will be presented with the following dialog box.
The first field allows you to enter a project file. If you are running ermineJ for the first time, you won’t have any projects. You can read more about projects here, but for now we’ll assume you are starting from scratch.
The next two fields are the inputs for the files ErmineJ requires to start. For more information on these input files, see the “Gene set description” topic and the “Gene Annotation” topic. We cover the essentials here.
GO file (OBO): This file contains the names and relationships among the GO terms, but no gene annotations. ErmineJ is set up to use the GO by default (though you don’t necessarily need to use it). ErmineJ will automatically download the GO OBO file for you and store it in your ermineJ.data directory. Otherwise enter the GO file you want to use. Note that the GO file is currently required even if you aren’t using GO. Note 2: XML support has been removed as of version 3.2
Gene Annotation file: This describes the mapping of the terms (e.g. GO) to the identifiers in your data (e.g. genes or probes). Select and the platform (e.g. microarray) annotation file, using the “Browse” buttons to locate them on your computer. Alternatively, you can obtain annotation files using the “Get from Gemma” option as explained here.
If you intend to use the example data, pick the GPL91 annotation file or download it directly.
Then click on “Start”.
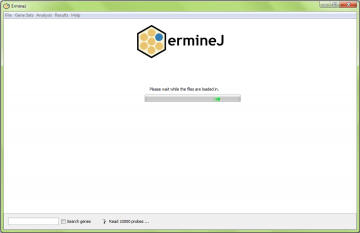
Then you will have a brief wait while the data files are loaded. These data are used for the remaining analysis and will only have to be loaded once. Here is what the loading screen looks like:

If you have already saved project files, you can choose one of them instead. There is more information on project files available.
If you have previously used the software, your last selected GO and annotation files will be automatically filled in.
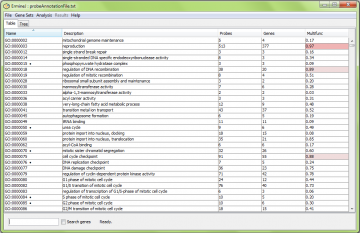
Once loading is finished (~15-30 seconds) the following “table view” is shown.

The three key parts of this window are:
- The “output panel” listing available gene sets either in a table or in a tree (see below).
- The “menu bar”, which is used to access analyses and other functions
- The “status bar” at the bottom of the window that is used to display pertinent information.
The menus are:
-
File – used to quit the program, switch annotations used, and to load or save projects. Projects are a way to save settings and results together for easier switching between them in the software.
-
Gene sets – used to modify or create new gene sets as well as search for gene sets. A menu item is available to reload the user-defined gene sets, which can be useful if new ones have been added or you have edited the files.
- Analysis – used to view diagnostics, run analyses, load or save results. Also to cancel an analysis while it is running. Finally, you can set the raw data file and gene score file. This is also settable from the analysis wizard and in the details view for a gene set.
-
Results – Used to switch the results set shown in the tree view. It will be inactive if you are viewing the table view or have done fewer than 2 analyses.
-
Help – used to reach these pages and view credits. You can also view the log file, which can be useful when reporting problems with the software.
There are shortcut keys for many of the menu items.
There are some additional features of the interface described below.
Table view
The table view always shows five columns (and others, once you have done some analysis); clicking on a column header will re-sort the table according to the selected column.
Note that GO terms with no members in your array design, or more than 2000 members, are not displayed on the table.
The table’s columns are:
-
- Name: The name of the group. For GO terms this is the GO ID. If there is a bullet (•), it means the group has the exact same members as one or more groups. Details are available from the tooltip (hover over the field).
- Description: The longer human-readable name of the group, if available.
- Size: The number of genes that are in the group. This value is always the number of genes represented in the annotations, even if your data set (which may not have been entered yet) has filtered out some of the results. See this note. If there are more than one element (e.g. probe) for any genes, the total number of elements is shown in brackets “[30]. This is primarily an issue for microarray platforms where there can be more than one probe (or probe set) for one gene. This value reflects the number of probes in your annotations, even if your data set does not use them all. See this note.
- Multifunc: A score ranging from 0 to 1 indicating the degree to which the group is biased towards multifunctional genes, where 1 is the highest. The value shown is the normalized rank. Hovering over it will show more information including the underlying score (AUC and p-value). A multifunctional gene is one that is in more than one group. The color is a visual guide, where deeper shades of red indicate more multifunctionality. Highly multifunctional groups should be considered relatively “functionally non-specific”. Details about multifunctionality are given here
Important: The “Size” column shows genes based on the annotation file, not necessarily the number represented in your gene scores. Please read this note for more explanation. To get the number used in an analysis, hover your the mouse pointer over the relevant analysis results column and read the sizes from the tooltip.
After an analysis has been done, additional columns will be added to this table. These are explained elsewhere.
The tree view
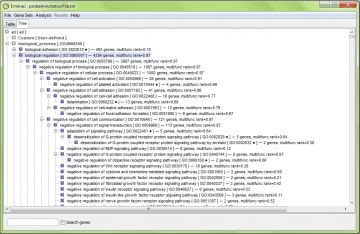
The “tree” tab switches you to a view of the gene sets in a hierarchy. This view is linked to the table view in many ways. You can use either or both views, depending on what you are doing and which you prefer. There are more details on the tree view here, and in the analysis results explanation.

In the the tree panel, the entire Gene Ontology is displayed (subject to your filtering settings), along with gene sets you have defined (under “user-defined”).
Additional functionality of the main panel
In addition to the obvious features shown above, there are other functionalities of the main panel:
Mouse button actions
- Double-clicking on a gene set in either the table or tree brings up the details view for that gene set.
- On both the tree and table view, there is a “popup” or “context-specific” menu (right-click on windows, option-click on Mac) for gene sets that makes it easier to use common functions and search the Gene Ontology web site. There is a different popup menu for different parts of the table and some functions are only available from the tree view or the table view.
- Clicking on the table headers resorts the table.
Tooltips
There are “tooltips” that are used to display extra information that would otherwise clutter up the interface. Hover the mouse over a field in the table or a line in the tree to see this. Specifically:
- On both the tree and table views, hovering over a gene set ID or name brings up a tooltip that shows the GO aspect and definition (if any).
- In the table view, hovering over a result p-value shows detailed statistics (when you first start the software there are no results columns, so this will make more sense once you do). The score that is shown is explained here
- In the table view, hovering over the header of a results column shows a summary of the settings that were used
